
For the last couple of years, I have spent a large portion of my life attempting to solve the unsolvable: forecasting time series to predict the future. I have personally thought myself quite clever for the various innovations I have come up with, and the thousands of users on my free and open-source AutoTS project suggests others have appreciated the work as well. And this is valuable work, the key to reducing waste, improving sustainable energy management, and countless other real world benefits. Yet I haven’t had much to really prove my work on a grander stage until now.
What happened? Well, I won the investment decisions overall category of the M6 financial forecasting competition. This competition is the sixth in a line of the most prestigious forecasting competitions that exist, started back in the 1980’s. The total prizes are equal to $300,000 although split among time periods and different places that I only take home a small (but still quite nice) part of that. I (Colin Catlin) participated alone using the team name Galloping Gargoyles, a phrase from Harry Potter that has long been floating around in my head.
The competition was rather intense! Over the course of an entire year through 2022, one weekend each month I made a submission of my predictions on what the stock market would do for the next month. There were two categories: a relative ranking of stocks, the ‘forecast’ category, and a decisions category for what percentage to buy/short in each stock.
Yes, stock picking from 100 different possible stocks, everything from Google and ExxonMobil to ‘iShares Msci Brazil ETF’ and other index funds you’ve never heard of. The M6 competition is exactly that, arguably the hardest forecasting challenge out there. And to my great surprise, I appear to have consistently beat the market and won the competition using just my time series forecasting skills.
It was a little challenging for me having to make submissions while traveling around the world as a digital nomad. Computer issues and traveling on submission weekends made for me some tight deadlines and less-than-ideal submissions. I imagine it must have been the same for many competitors. Having multiple submissions throughout a year is really the best way to judge the competition, but it definitely came with challenges too. I have no idea about the backgrounds of the other 163 teams. Were they mostly a bunch of lone wolves like me, cramming in some spare time on the weekends, or teams of motivated people with strong financial backgrounds? I have no idea!
So what did I do to win the competition? It was quite simple in summary. I used my AutoTS Python package to generate forecasts. AutoTS is really the answer to why I won. Feel free to skip reading the rest of this article, and go check it out instead.
Winning Methodology
AutoTS, an abbreviation of “automated time series forecasting” makes generating top forecasts super quick and easy as it is a subclass of automated machine learning (often called AutoML) which is itself a domain of the thing we confusingly label as artificial intelligence, AI. My AutoTS package has many preprocessing methods and many of forecasting models. The magic comes in how it combines them, optimizes them with a genetic algorithm, and evaluates and chooses the best. Many data scientists see automated machine learning as a shortcut for quick work, perhaps more honestly worried it will take away their high salaries. I see it differently. AutoML here is critical for the complexity of the models that are being generated and for how they are being evaluated. It also reduces the single greatest destroyer of forecasting performance: human bias.
There are parameters to tune and things to adjust, of course, even in ‘automated’ machine learning, although it’s nothing too complicated. Most of my work for this competition went into writing a script to take my point, upper, and lower forecasts and turn them into the ranked probability score and the forecast decision. I actually didn’t attempt to duplicate the IR metric they used for the decisions category but instead went for a simple percent return for my evaluation. I did try to optimize on the RPS metric, despite my misgivings about it. With hindsight I should have focused exclusively on forecasting returns. I used the same forecast output as basis for both category submissions.
One nice thing about the stock market is that there is quite a lot of history. For some stocks there is fifty years or more of daily pricing, which is way more than many forecasting scenarios. I trimmed down the import to only data from the last 5 years, so for the last submission period, starting from January 2018. This is partly for speed, a few more years of data likely could help a little, but really old data (the fifty year old stuff) is likely to be worse than useless as so much has changed since then. I added some external information from FRED and the like, but mostly the models chose not to use this (when I say “models chose” I mean “the optimization process found it to be of no or negative benefit in cross validation”), or models were chosen that couldn’t use external regressors. In forecasting terms, most external information here likely has too much noise and not enough relevant signal to be helpful consistently. In financial context too, I believe the signals the market is listening to often change as traders follow fads and latest worries most closely.
I decided to transform daily stock data into four week period data as that was the length of the submission interval, so I generated only one forecast step ahead, that of the end of the next four weeks. No need to worry about the journey, here only the destination matters!
For those who don’t know, a ‘point forecast’ is simply the most likely predicted stock price, the median or 50th percentile, ie what most people think of as the ‘forecast’ which is also offered with upper and lower forecasts which are “here is how high and low a price we are likely to see.” I tried various combinations of probabilistic ranges but found using just the 90% prediction interval to be simple yet effective. These upper and lower ranges, so called probabilistic forecasting, are critical to making good forecasts.
One of the greatest challenges in forecasting is getting business people to work with probabilistic forecasts. They usually want just one number, one simple answer, but there is almost never just one answer for what the future can bring. Here, thankfully, I get to make the decision using all the available information, without having to go through business people first.
To turn point, upper, and lower forecasts into investment decisions, I used a ‘hinge’ method where I took the simple average of the upper and lower forecasts and used that instead of the point forecast. This proved to be slightly superior to using a point forecast. I then turned this hinge forecast into a percentage return for the month by simply taking my forecast price against the starting price, normalized it with the other stocks returns, and rounded down, thus generating my investment amount for the month.
My testing actually later came up with a better, lower-risk approach which was agreement forecasting. For agreement forecasting, if all forecasts of upper, point, and lower forecasts agree on the percent return direction, these stocks are invested in (or shorted as appropriate) and stocks that don’t have such agreement are ignored. I didn’t actually ever switch my submission script to use this (I was too lazy), but fyi that my testing suggested it was better. There are countless other ways to take these raw forecast outputs and turn them into investment decisions, it is quite likely there is a better approach than the few simple approaches I tried.
This competition did inspire me to come up with directional weighted accuracy (oda, dwae) for AutoTS, which I saw as an improvement and which is what I would have used to evaluate the forecast category rather than RPS. My ‘motif’ style models were also critical to the forecasting, and I happened to add improved versions of those during the competition, as well as a number of other updates throughout the year, although none of these other updates were directly inspired by the completion.
My work on the competition was concentrated during several periods: Jan-Feb ‘22, May-June ‘22, Sept-Oct ‘22. Unfortunately, I lost the history of about half of my submissions and the corresponding models chosen for them when my workstation’s SSD suffered an untimely early death near the end of the competition, so this, combined with the numerous updates and changes to AutoTS over the year, mean it is difficult to go back and assess what models and params are definitively best. Generally I can say the chosen model(s) changed month to month and there was no one clear ‘best’ model for predicting stocks, more a pool of valuable contenders.
Performance Evaluation
I haven’t actually looked in great detail at my performance throughout the year, but I would strongly suppose that my ending performance was stronger than my beginning performance (this might be hard to see clearly in raw investment performance due to the noise and general chaos of the stock market). This would have been because of general AutoTS updates, some tweaks and improvements to my competition script, and also just to the nature of the genetic algorithms which evolved from each previous submission, gradually finding model improvements as it had more time to search the extremely large parameter search space that AutoTS has. I came in to the competition never having seriously tried to predict the stock market, but by the end I had spent a year doing it and had learned a few things.
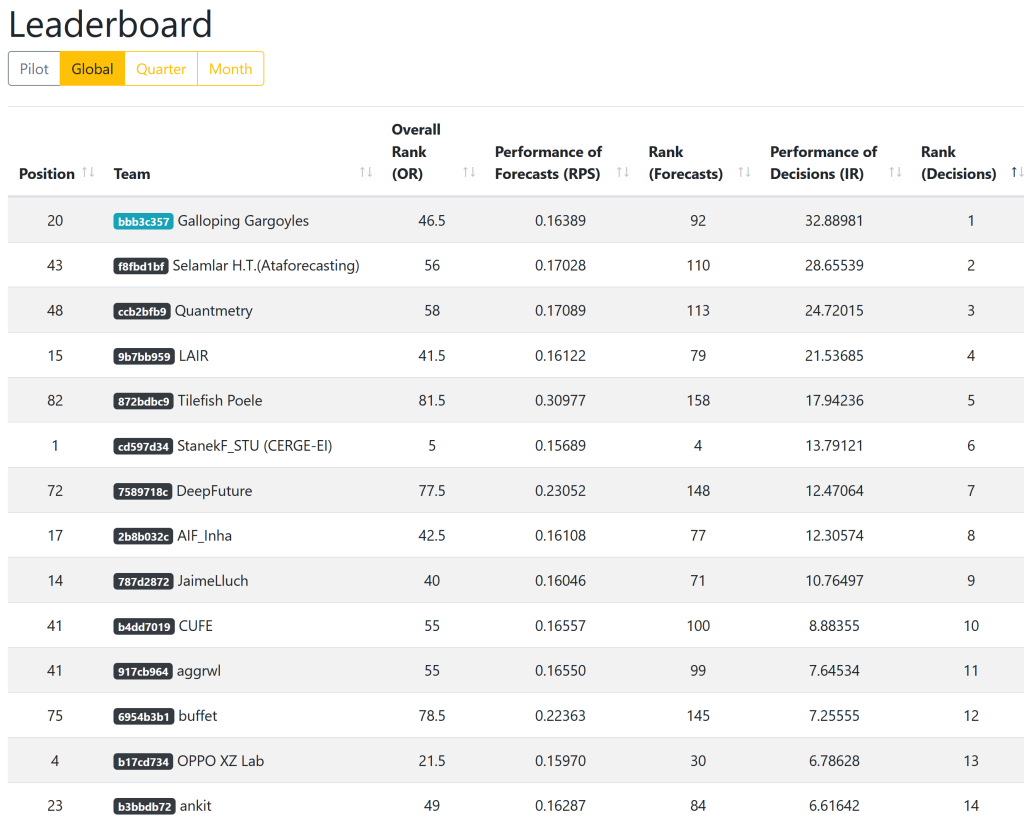
It is a valid hypothesis that I won just by luck, stock markets do tend to work out that way, but it is more likely that I won as a result of skill. Luck is mostly ruled out by taking the performance over 12 submissions – being a lucky 12 times is much harder than just once. This can also be seen if you look at the distribution of the scores, you will see that my 32.89 is very much an outlier, with a handful of people in the 20’s for scores but the majority are quite close to 0 as you would expect.
More people seem to have done quite poorly (-20) rather than quite well (+20). My guess as to why this happened is that the stock market in 2022 was really a turbulent year that broke from long term trends. The market has been in constant growth since pretty much 2009, excepting a rapidly-recovering covid dip in 2020. The outstanding performers of the last decade, tech companies, really took a beating and did poorly. Inflation was a big concern for the first time in many years. I can tell you that if I had been using my own ‘investment instinct’ rather than my models, I almost certainly would have been in the -20 group as well, as the following case shows.
Only once did I manually adjust the forecast (this was I believe March or April 2022). I disagreed with my model about the performance of Amazon. Amazon had just taking a beating the previous month and I was certain its stock would rebound, so I took the model’s negative forecast and switched it to a large positive investment (40% of my entire investment for the month, as I recall). I was very wrong, and the model was right. Amazon stock fell even more that next month. Lesson learned, models may often be wrong but I am wrong even more often.
It should be noted that I have nearly zero corporate financial knowledge (I did take one course at my university, the University of Minnesota) and my understanding of the stock market is only slightly better than the average person. My personal investment strategy is “hold cash until the next market dip, then invest in a diversified and low expense index or mutual fund.”
I personally work as a data scientist, with a masters degree in the field, and dual undergraduate degrees in both Neuroscience and Classics (ie Roman and Near Eastern history). As deep as I am into my research, I don’t have a PhD (and unfortunately, some people have been biased against my work due to a lack of a those extra letters with my name).
As an aside, my long time interest in history is one of the reasons I find forecasting so interesting, and is one of my strengths in the field as I want to understand the flow of probabilities from past to present to future. Forecasting is purely a passion, and I think my lack of seeking much direct benefit from my work is one of the reasons I have come up with things that others have not.
You might be wondering, why, if my forecasts were so good to lead to good investment decisions, why then I didn’t win in the ‘forecasts’ category scored by the RPS metric. I definitely find it amusing that I did only slight better than average in the rankings for the ‘forecast’ category, but did best in the “investment decisions” category, when my submissions were entirely based on time series forecasts, with no fancy investment strategy or any stock market type knowledge applied.
Poor performance in RPS also didn’t surprise me at all. As I wrote about near the begin of the competition, the RPS score used for evaluating the forecast category is a terrible choice for assessing stock market forecasts. Indeed almost all teams fall within the same narrow range of scores from 0.155 to 0.165 of the forecast category, a suspiciously tiny range suggesting almost no differentiation between competitors besides luck, and with no correlation with investment decision performance. I thought RPS would just be subpar, but it actually turned out to be outright awful.
The problem with RPS, ranked probability score, in short, is that it was used mostly for judging sports tournaments predictions, like the FIFA World Cup or March Madness for basketball, where there is always a ranking and clear winner, Argentina beats France. To clearly ‘win’ a stock price ranking, a company’s market price suddenly has to become a ton more valuable – established companies and especially index funds just don’t do that (well, occasionally they do the opposite and clearly ‘lose’ and collapse). Startups might occasionally grow explosively in market value, as they are discovered by the mainstream, but startups aren’t included in this competition’s market – in a startup-only market, RPS might actually make a bit of sense (startups would have a different challenge: a lack of historical data for forecasting models). In reality, because most stocks follow the general market direction most of the time, the actual variance between the stocks that determines the ranking is often very small, and effectively random. Furthermore, if you know just a few stocks very accurately, you could make great investment decisions, but a full ranking would require excellent accuracy on all stocks. Rankings simply make no sense in the context of the stock market.
Actually rankings make no sense in any quantitative context. Rankings solve a human need to simplify comparisons for quick judgements (university rankings, google’s page ranks, sports betting, class ranks – all of which have faced frequent criticism) but never present the fairest overall assessment. For cases where a ranking is initially desired, instead create some kind of a preference-adjustable “score”, which allows for ties and shows whether differences are really big or almost nonexistent.
Conclusion
Takeaways from this competition.
This competition reinforced the value of a few things. The value of automated forecasting, as it won. Also the supreme importance of choosing good evaluation metrics, something I have long been obsessed about (I am a bit of a metric connoisseur). Also the importance of performing multiple validations (here 12 submissions) in order to get a proper assessment of forecasting methods. Twelve validations is overkill for most cases, but the stock market is more wild than most forecasting cases.
I must say, overall, I am really excited to have had myself and AutoTS manage a victory. It will look good on the resume. All that time I have spent building AutoTS, when I could have been partying or watching Netflix like most young people feels very much worth it, as does the idea of continuing with much more work on the project. And that work, in turn, benefits the world. Forecasting is really challenging to use well, but very valuable when it is. If I continue to make it simple enough to apply everywhere, even on these most challenging problems, that can make a big difference in a way few other things can.
Well done :–)
Also, you had 1 data point per month, hence 12 per year.
Can I ask how much historical data you used? Just all that was available for each stock?
And did you solve this as a multivariable optimisation, or each time series independently?
Really makes me think of some cool ideas in my own area of water quality science :–)
Technically 13 data points per year, with 4 week periods. There is a lot of history for most of the stocks, I removed anything older than the year 2000. AutoTS has ‘horizontal ensembling’ which chooses individual models for each series, but those individual models can be multivariate models fed with all the data, so it gets to be a mix. Somewhat confusing, but works well.
You are a legend. Well done on all of your hard work. Do you intend to continue to improve and develop your package?
I definitely plan to continue improving AutoTS, although the basics are down pretty well. Future work is likely model improvements, perhaps some fine-tuning of the metrics.
Thank you for sharing your experience, I think this is a very great achievement, I am learning on my own and it is very useful for me, thank you again