For several years I have had a To-Do list item to improve my server monitoring setup. The value is to have a quick and easy way to make sure everything appears to be going well inside the network: unexplained spikes in cpu or network usage might suggest that the network has been compromised. It’s also useful for keeping an eye on performance and easily seeing where any slow downs might be coming from.
Today, I finally built that monitoring, in only an hour and a half.
I was guided by this article from the official Ubuntu docs. I think my challenge with this in the past is that there is a lot of information to sort through to find the answers on monitoring. There are many paid or freemium type apps out there advertising. There are also lots of solutions guides for monitoring very specific, very complicated solutions. I had heard of most of these tools before, but wasn’t sure how to put them all together. In particular I was unaware of Telegraf as a one-stop-shop for collecting metrics and exporting them.
Turns out the open source path to this is pretty simple:
1. install and configure Telegraf, this collects metrics and exposes them for collection
2. install and configure Prometheus, this scrapes the data from all telegraf nodes into one database, with basic visualization
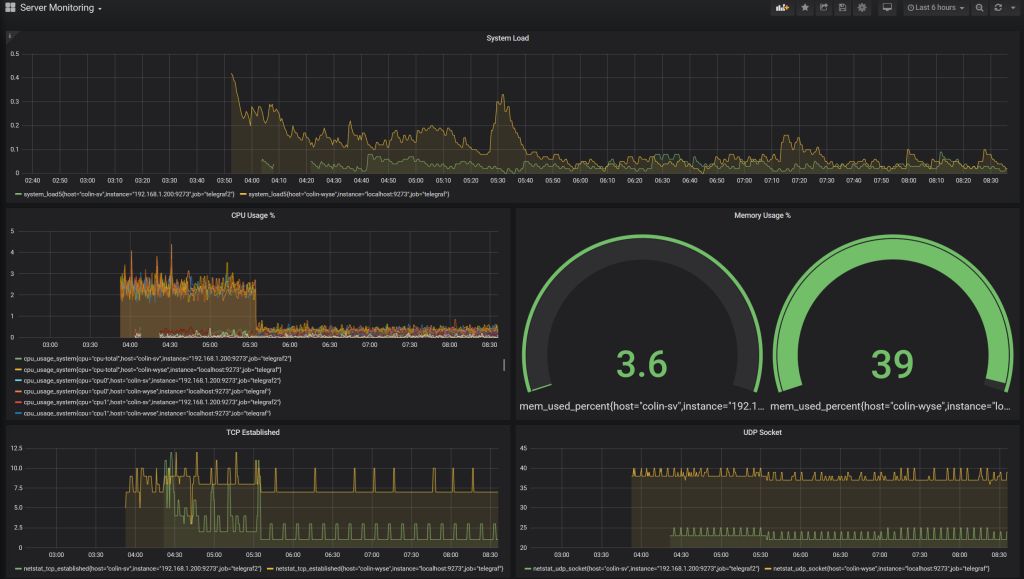
3. install and configure Grafana (optional), this visualizes the data with fancy options
Ubuntu’s snap (essentially containerized) made Prometheus and Grafana very easy to install, and for Telegraf I just went for the simple apt install. And thanks to awesome devs, the preinstalled defaults basically ‘just worked’ out of the box with only minor adjustments needed.
Telegraf is produced by InfluxDB people, and with an MIT License seems likely to stay free as their profit comes from the database and the collection tool has no premium version or reason to go premium. Prometheus is a Cloud Native project, ie run entirely by open source for open source. Grafana is the only product which is a corporate freemium type tool where there is a risk they later close down the license and restrict product updates. However, as switching out dashboards is easier than switching out all the collection streams, this is less of a concern.
I still need to put more effort into understanding how to best monitor the network metrics, perhaps using snmp. And with Telegraf, there is an vast array of collection options, so in the future I may be interested in collecting more detailed metrics to monitor more specific services. One potential failure point here is that the Prometheus database is not backed up nor is any of this system high availability for fault tolerance. Since for me, the loss of all monitoring metrics would be annoying but not critical, that is currently acceptable.