One of the more exciting new features coming soon to AutoTS is the automatic detection of holidays. That’s exactly what it sounds like: figuring out when holidays are occurring and being able to generate that calendar for the future.
Firstly, why is this needed? A couple of reasons. The big reason is that holidays are often large discrete spikes (or dips) which can be very hard for many models to deal with (they prefer smoother changes generally). Generating a calendar of them (to use as a flag, feature, or subtracted impact) helps a lot with accuracy. It also helps with explainability: this spike is happening because of a holiday (and not just some random anomaly).
Now, the state of the art right now for holiday detection is having a massive database of holidays to use as features for all countries of interest. This has problems. The first is that it is high maintenance. The second is that it misses holidays. Thirdly, I have found that including excessive numbers of not-relevant holidays can actually decrease accuracy around 25% with Prophet. Finally, a really cool feature of holiday detection is that it isn’t just holidays, it is any events that happen to follow a consistent calendar. So all in all, you get improved accuracy and explainability with more relevant holiday and event detection.
Academia seems to have ignored this holiday detection problem. I presume because of the time put into each individual paper, holidays, when used (they often seem ignored), could always be manually identified and curated into features as needed. The best paper I dug up on this topic was Modeling public holidays in load forecasting: a German case study.
Okay, you’re probably sold on why, now how about how to detect holidays? It is actually a rather simple process logically:
- Run anomaly detection
- Generate relevant calendars
- Find if any particular calendar days (week day of month, lunar calendar, etc) are always/almost-always anomalies
Simple process but hard to make work well. Firstly, I had to generate a whole bunch of anomaly detection methods to cover the whole range of possible detections (from aggressive to very cautious) which was helped by combining with my large pile of preprocessing transformers in AutoTS so that some less-than-obvious anomalies can stand out. As a byproduct, AutoTS now has an AnomalyDetector class on hand. It looks generally like more greedy anomaly detection methods are the best, but there’s a fine line between greedy enough and too greedy. I let my genetic algorithms handle that optimization as part of the modeling process.
Calendars are perhaps the single biggest challenge. Writing up Lunar, Islamic, and Hebrew calendars was not a simple process. I think my lunar calendar has some errors in +/- 200 years or so, but for practical purposes I think it is good (it’s based directly on lunar phase mathematics). One problem here is that unless you have a lot of history (10 years) it often happens that these other calendars identify holidays they shouldn’t. For example. all calendars pick up something for Christmas, because Christmas is usually a broad area of anomalies. However, those associations won’t necessarily hold true in the long term or even medium term. Usually best to just use the fewest possible calendars (day of month and weekday of month for the Gregorian) unless you really think the Lunar, or other, calendar is important for your dataset.
With short-ish history (3-4 years) aligning holidays and anomalies is tricky because it only takes a little variation in one year or another to push something across the threshold. This is one of the reasons I left out multiyear holidays (like Presidential elections every 4 years) because they simply require way more history than is usually on hand. Here, only holidays occurring yearly (to some calendar) are detected.
I also added a splash effect to make it easier to pick up neighboring holidays if one nearby is a strong holiday. I decided to model holidays individually even if they were part of the same official holiday. I ultimately decided it was best to have Christmas Eve, Christmas, and Boxing Day all seen as separate holidays with different impacts, as opposed to one holiday going from December 24 to 26. I did not directly account for weekend occurrence impact of holidays (effect of moving holidays varies by day of week it is on) because there often isn’t enough history to see that effect properly, and this can still be done with a regression using the detection’s output flags if desired.
Code looks something like this:
from autots import HolidayDetector
# holiday detection, random parameters
holiday_params = HolidayDetector.get_new_params()
mod = HolidayDetector(**holiday_params)
mod.detect(df)
# several outputs are possible, you'll need to subset results from multivariate inputs
full_dates = pd.date_range("2014-01-01", "2024-01-01", freq='D')
prophet_holidays = mod.dates_to_holidays(full_dates, style="prophet")
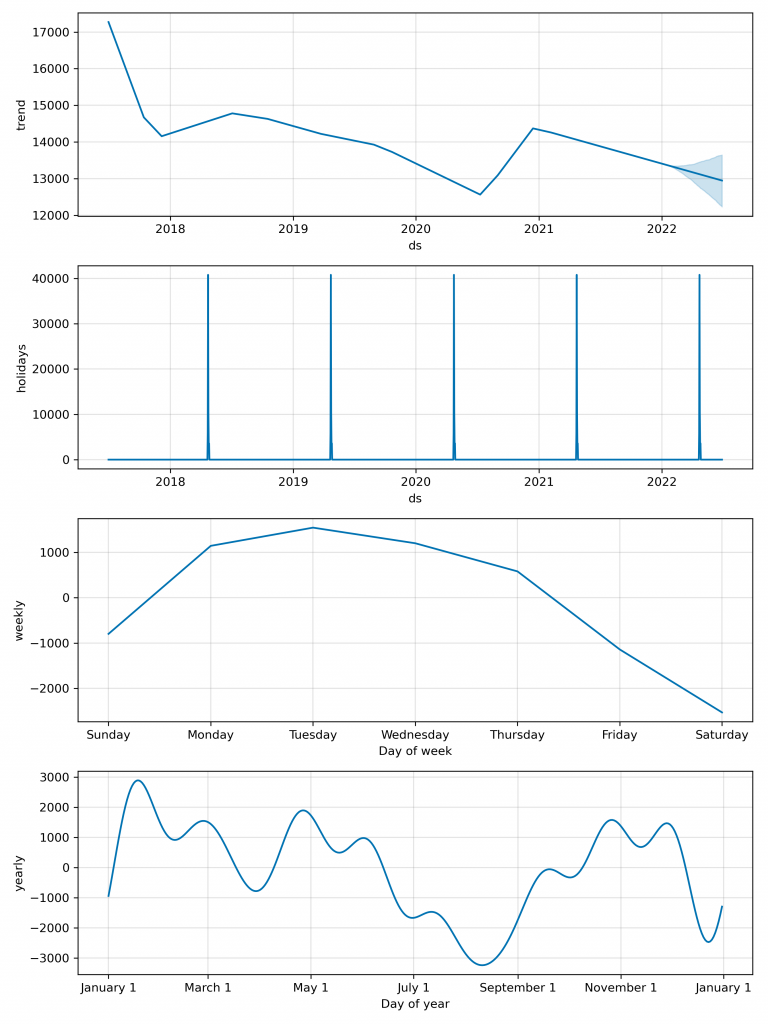
mod.plot()and a plot of results:
So how about results?
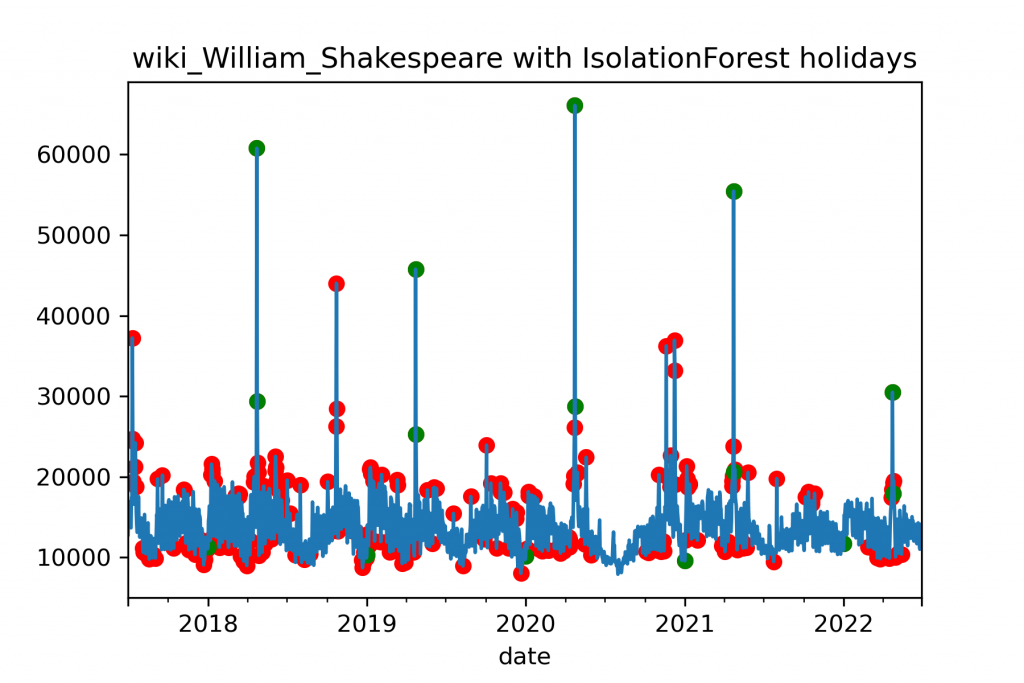
I used Wikipedia page view data because it comes in different types of activity (depending on article) and often has events that are predictable based on the name of the article, but may not be standard holidays. A good example of this is the page on William Shakespeare which has a spike around April 23 every year. That would be a holiday for this dataset, Shakespeare’s birthday.
I used Prophet because that’s a standard tool with my work, and because it remains the best general purpose forecasting algorithm around, helpfully with holidays considered as a major part in its modeling.
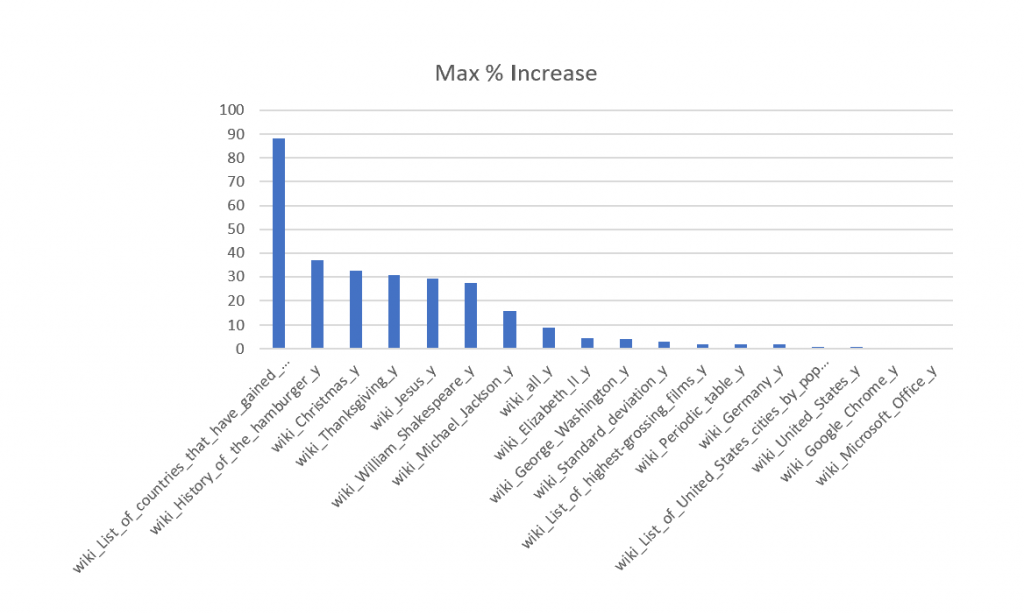
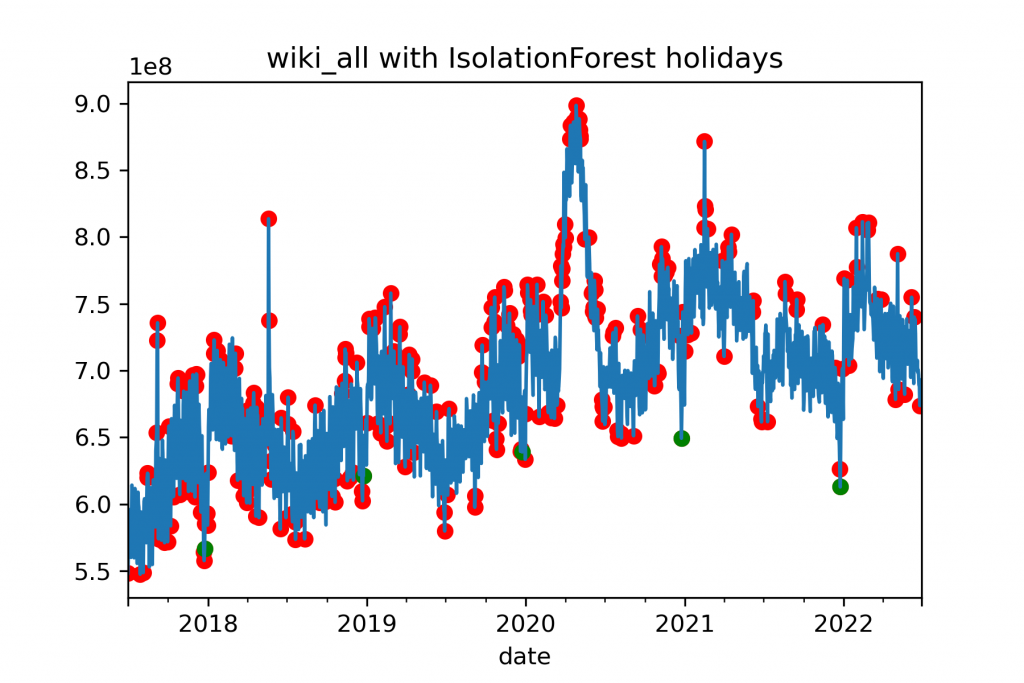
The conclusions are unsurprising. Datasets with large spikes on holidays but which are otherwise mostly flat see the biggest improvements (over 90% for List_of_countries_that_have_gained_independence_from_the_United_Kingdom) and is 0% or near 0% for series which have no or very little holiday influence. Most interesting to me is all traffic for Wikipedia, which is more representative of series I am concerned with and has some holiday influence, albeit somewhat less pronounced, hidden in aggregation. This sees a 5% performance increase safely, and I’ve seen as high as 10%. This also depends on the forecast horizon, performance improvements are best around holidays. This is with initial tuning, more might yield better results.
Not just holidays days benefit, removing the factors of holidays allows Prophet to do a better job of modeling trend and seasonality components as they no longer have to account for spikes they weren’t designed to handle, and can focus on trend, etc more exactly. Accordingly the improvement is year-round, albeit mostly around holidays.
While this doesn’t go into every nuance of what is being done, this captures the majority of the work. In AutoTS, I have this standalone detection class available for use, but have also built it into the Prophet model, as well as into a preprocessing transfomer called HolidayTransformer which has some nifty features. It also is a bit slow with some parameters, so I am still working on tuning the default range to generally faster parameters.