
An IMU (internal measurement unit) is an device that measures movement, usually an accelerometer and a gyroscope. This is the thing that lets your phone know when you’ve rotated the device so it knows to rotate the screen, can count steps, and helps your phone autostabilize the focus of its camera. They also help guide missiles to targets. They are very useful, and can be made in absolutely tiny pieces, made out of microscopic bits of silicon wobbling, causing microscopic capacitance changes that are measured.
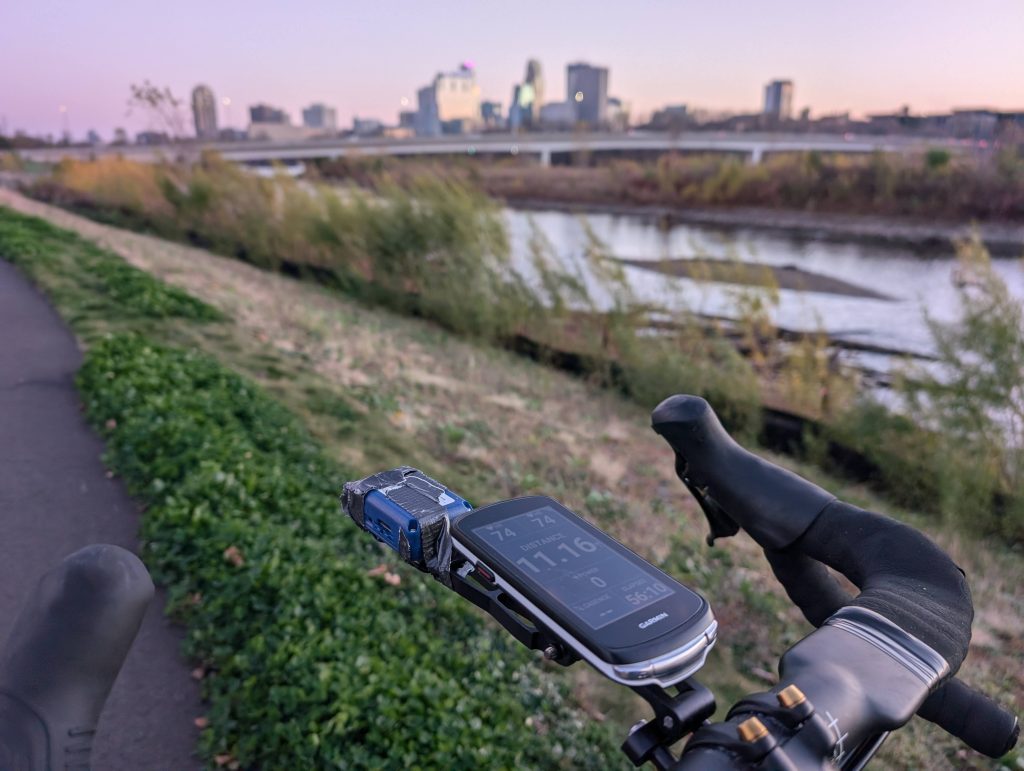
For the last few years now I have been on-and-off working on a personal aerodynamics sensor for my bike. The IMU I have chosen is the LSM6DSV16X from ST Micro. For one, it provides an ability to detect movement, enter a power-saving sleep mode when stationary, and wake up when it starts to move. But the LSM6DSV16X also has something really cool on it (in my opinion as a data scientist), a tiny machine learning core (MLC) optimized for running decision trees. And it can run these decision trees with milliwatts of power which makes it possibly the most energy efficient form of AI (albeit very lightweight, simple AI).
On an aerodynamics sensor, I have a few uses for this. The first is predicting the type of surface (smooth, rough, gravel, rocky) we are riding on. This is most useful for CdA calculations because the coefficient of rolling resistance (Crr) changes based on surface, and we need to detect what type of surface we are on to adjust calculations as needed. I also thought it would just be nice for more mixed surface gravel riders to be able to collect data on what type of surface they are on. It isn’t a perfect classification, some packed gravel is as smooth as freshly paved tarmac for example, but the goal here is to catch the big differences.
The second use is detecting type of movement of the rider. In particular I was interested in being able to do “automatic” coast down calibration by sensing when a rider is coasting (and not pedaling or braking). I also added in standing (out of the saddle riding), running, and of course, stationary as movement types.
I also calculated a third family of classifications: straight versus cornering. I don’t strictly need this data for the aerodynamics sensor (perhaps it can help calibrate the change in wind direction versus change in riders direction or being used to discard coast downs involving cornering), but I figured while I was out riding I might as well gather the data.
Gathering this data is quite hard. Trying to start, then stop, the classifier label on my phone with one hand while riding down really rough cobblestones (“rocky” label) or while actively turning (“cornering” label) is tricky. I really wanted clean, high quality data, but that is very hard to do. With gravel riding I tried to aim for the “average” type of gravel to record on here, Midwestern macadamized gravel, not too packed and not too rocky or washboarded. For “smooth” I aimed for small occasional seams at worst, and fresh new pavement at best. For “rough” I had a section of access road (headed towards the U of M from the east end of the stone arch bridge) which was nearly constant potholes and patch seams. Perhaps the most dangerous was trying to record “braking” as a category. I needed longer data records (ideally 2 or 3 seconds) which meant I had to start at high speed, start the label and start braking with the other hand.
I recorded at 240 Hz because that is the maximum frequency of the MLC core, and since earlier research suggested gravel road vibrations could be around 50 Hz, and, per Nyquist-Shannon sampling theorem, you need 2x the frequency to record at, 240 Hz seemed the safe choice for making sure we capture all the frequencies riders might see at higher speeds. I was also thinking that higher frequency label output, while likely to be a bit noisy, would end up being more accurate after being run through something like a kalman filter to smooth the data.
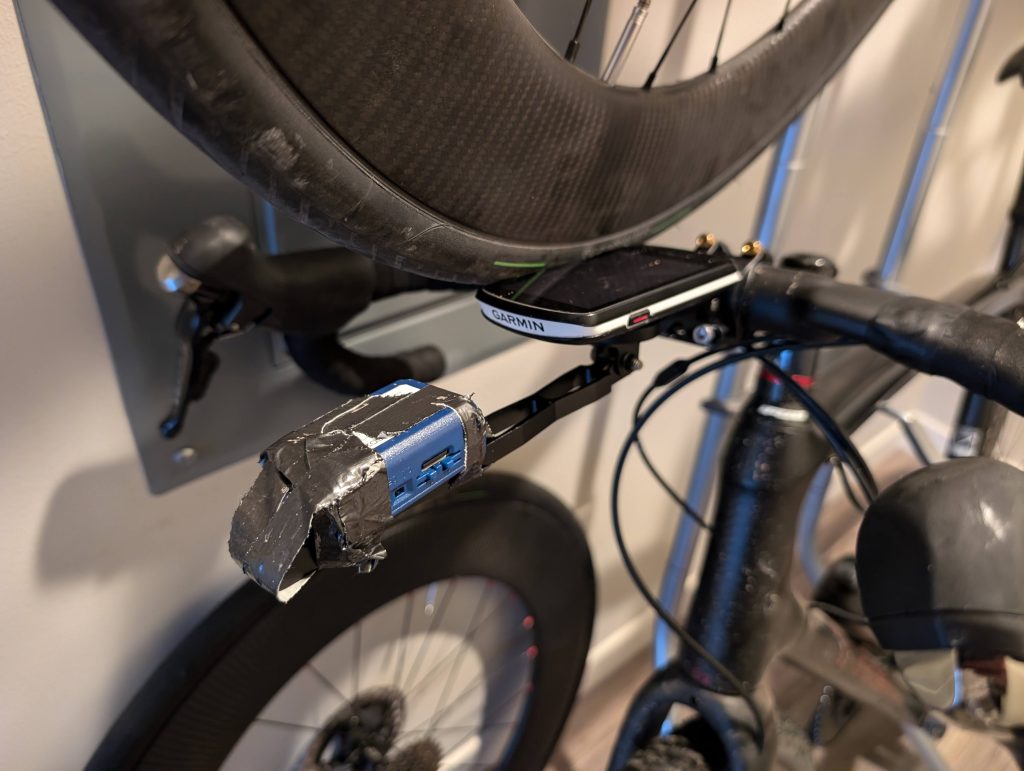
I used the STEVAL-MKBOXPRO (SensorTile.box PRO) to record data because it had the exact same sensor in it as I would be using on my custom circuit board, and it paired that with a phone app to help record the data. I had this mounted as it should be on the circuit board, which is where positive Y is forward acceleration, and positive Z is towards the ground (which is the opposite of most high school physics, where you model acceleration of gravity as negative, here it should be a positive). Positive X is left and negative X is right. You must use the same orientation of your sensor, or swap the numbers positive/negative as needed to adjust for your sensor orientation. In theory this data should be usable on another brand’s IMUs, but for most reliable results use the exact same sensor as recorded on here.
I collected the data over a year and a half ago. I ran into a blocker where the official eval sensor uses a different data collection format than the format used by the MEMS Studio software used to train models for the Machine Learning Core. It seems like ST Micro has different teams working on different parts of the project. I had to try and hack together a data conversion script in Python, which kind of worked but I ended up getting stuck before finishing modeling. One advantage of waiting a year is that they finally updated the software so they had a built in data conversion tool to switch from the HSDataLogger format to a CSV. Of course they only let it convert one file at a time so I had to spend two hours (while watching a movie) to convert all the files…
ST Micro seems to do a good job of putting files out on GitHub for anyone to reference, and publishing tons of data sheets, but they could learn from Raspberry Pi and release even more idiot-proof beginner documentation.
There is probably still some bad data in here. Removing the first few records from the start and end of each recording might help clean it up a little bit. I used two different bikes (my Specialized Tarmac and my Trek Boone CX/Gravel bike). I also have mixed data from a couple of different recording positions: “long arm” which is how the aerosensor will be mounted, a GoPro type mount extending some 200 mm in front of the handlebars, plus taped to the bottom of the handlebars (both left and right sides). I also mixed data from different data ranges. I was surprised how high the g’s go. I had foolishly assumed, from reading about fighter jets, that 4g would be quite high. Nope, turns out hitting even 16 g’s of sudden upward motion (for a very short duration) is common when hitting a pothole. No wonder our arms can get so sore when riding on bumpy roads. At the end I settled on 8g, 2000 dps, but with a mixed range here it should be somewhat tolerant of being reused on various sensor range settings. In general, I aimed for generalizable data, but ultimately different bikes, different people, different riding styles might not align.
By releasing this open source at https://github.com/winedarksea/Cycling-IMU-Data/ I am mostly expecting this to be picked up by college students for class projects, but it might also be helpful for others developing products as well.
Labels:
0 = smooth
1 = rough
2 = gravel
3 = rocky
4 = coasting
5 = braking
6 = stationary
7 = pedalling
8 = standing (ie “out of the saddle” riding, climbing)
9 = running
10 = straight (not entirely sure on this one, lost the label)
11 = cornering (again, this and 10 might be swapped around, can’t remember for sure)