

It can be difficult, as an absentee farmer, to really have a good idea of what is going on with everything that is being managed. Now true, my parents are about to retire and stay at the farm full-time, but I won’t be doing so myself any time soon.
There’s also just something weird about the micro-climate of the farm. The farm is right near the Mississippi River’s Lake Pepin, in a rather narrow valley at its edge. It is, supposedly, milder in winter as a result. Yet I’ve also had a fair amount of trouble with fruit trees, even zone 4 hardy ones (and some maps say the farm is zone 5), dying off at the top. It could be their full exposure to a west wind (channeled by the east-west facing valley) is the problem. Well, I don’t really know what the problem is, hence this project.
Finally, of course, I’m from a scientific family who applies that science a bit in lots of places. My dad’s hop vines, in particular are a subject of interest to him. So together, absentee farmer, scientific farming, and microclimate understanding will all be improved on by data science. Of course, first we need data, by setting up sensors (call them IoT sensors, to be trendy) to look at the weather -the backbone of all agriculture.
When I was younger, I really wanted to be a weatherman. Too much time watching the movie Twister, I think. Now, with this data, maybe I should start generating my own forecasts?
Sensor Network
I’ve already discussed setting up the weather station last week. To add to that, I have two additional sources of data on-hand: the data streaming off of our farm’s small solar array, and the national government data provided by the USGS.
The USGS Water Service data is of particular interest because I am curious about the lake effect of Lake Pepin on our farm. Conveniently, just over the bluff there is station near Read’s Landing recording temperature, flow, discharge, and level. There is also, a few miles south, a station near Kellogg on the Zumbro River. The Zumbro River should be of interest as well because the water flow from it’s watershed should be comparable directly to the farm.
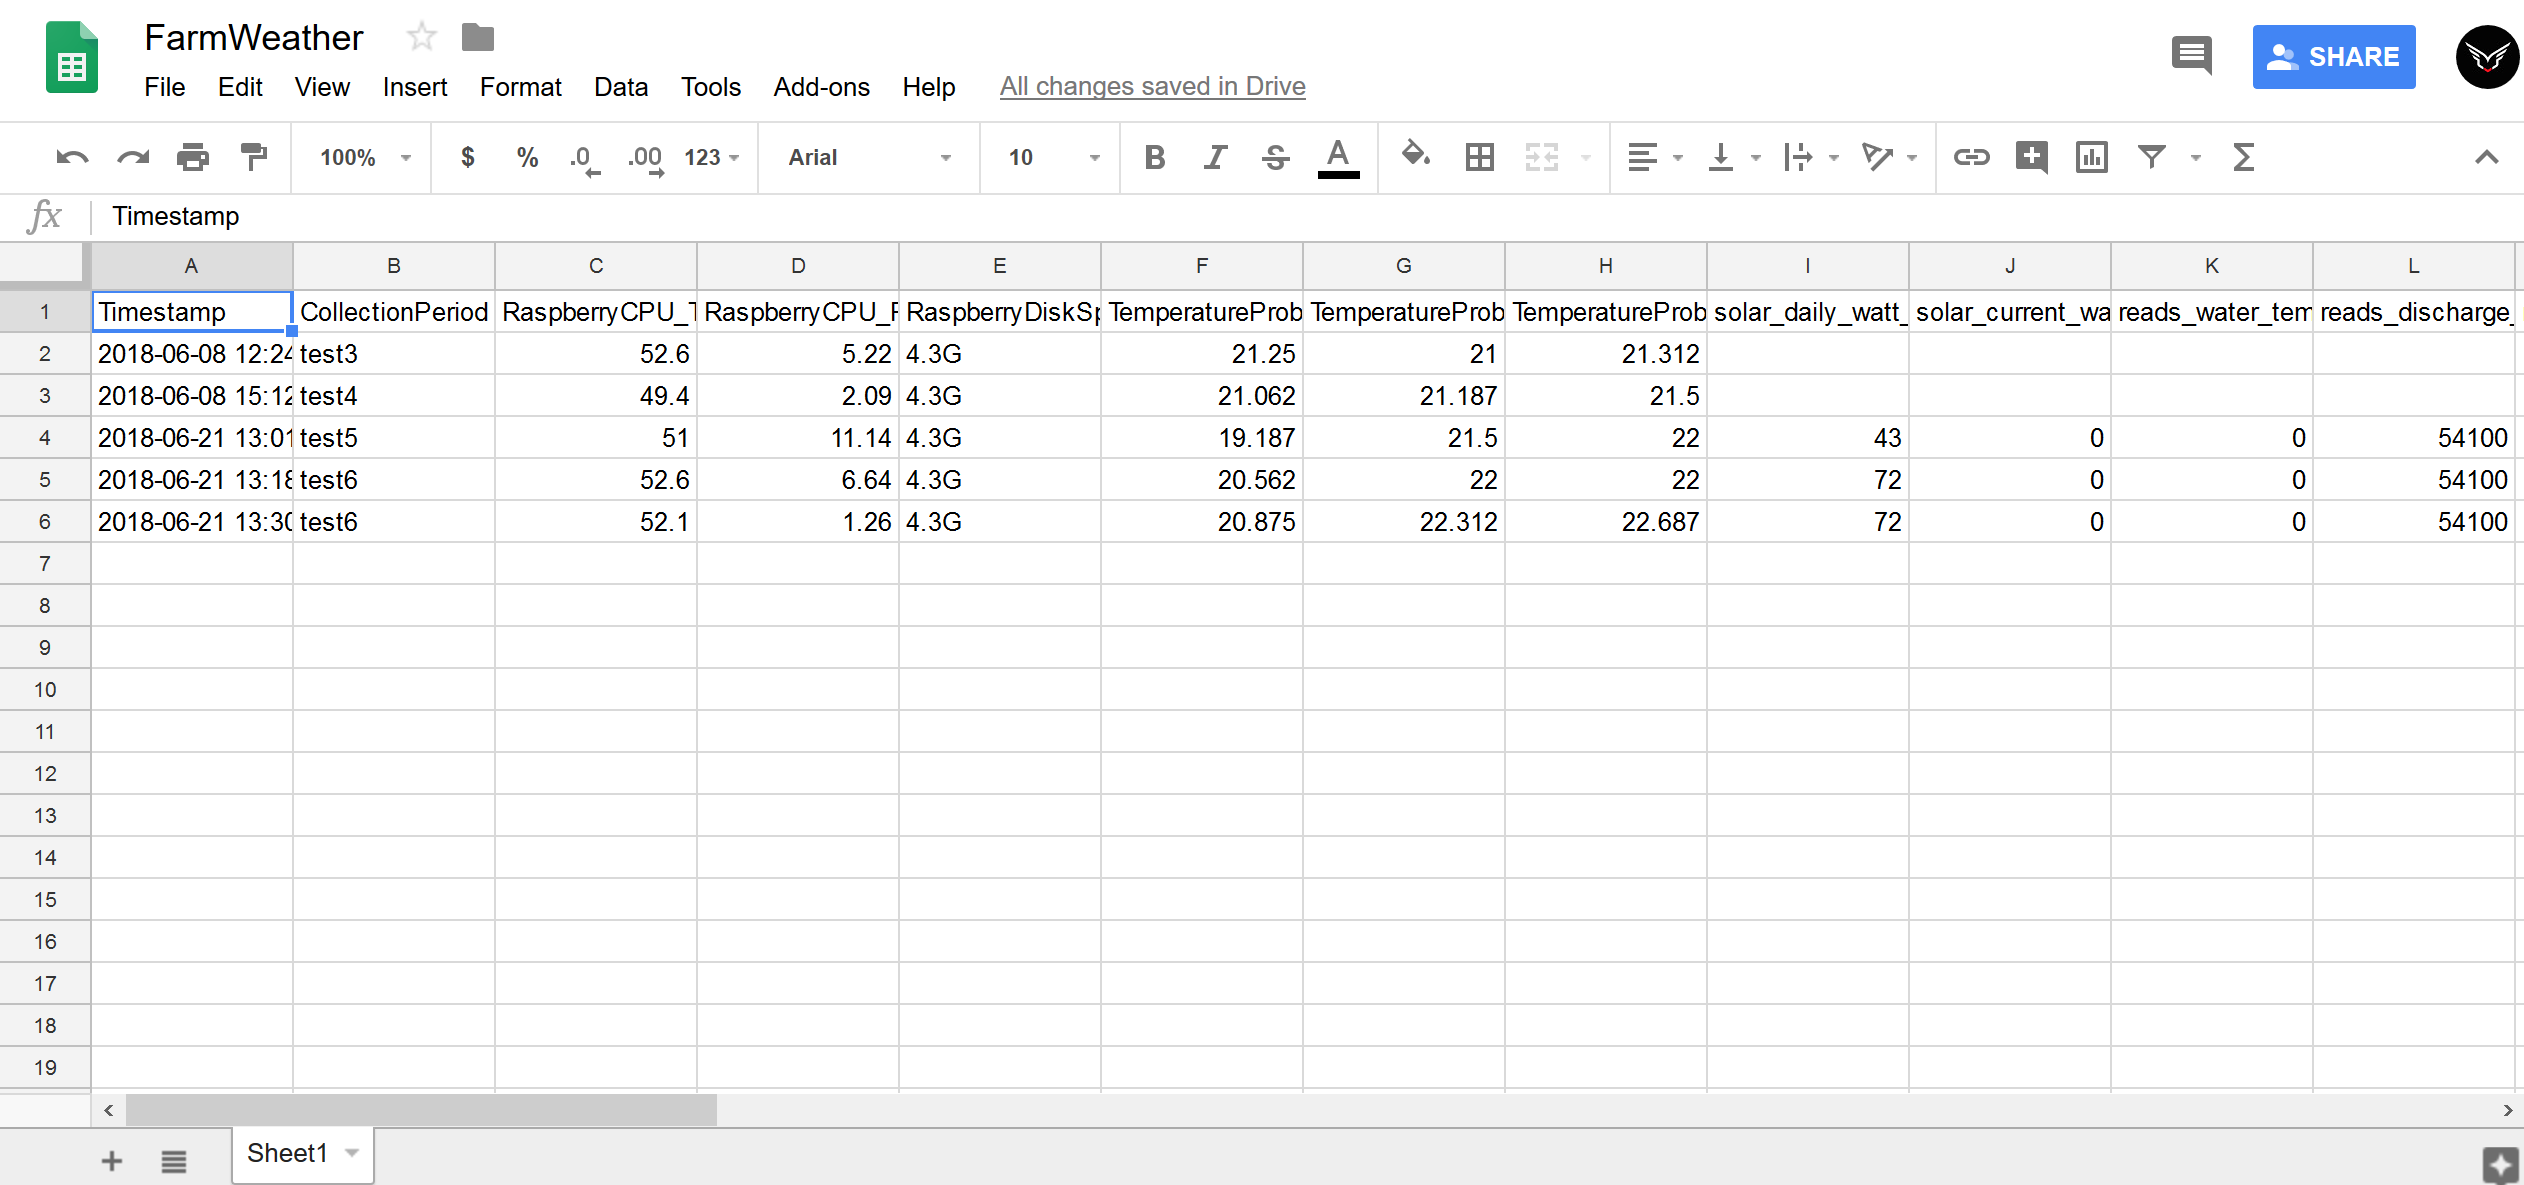
Finally, I have a few temperature probes attached to the Raspberry Pi. I really am only interested in have one to measure soil temperature, with two others measuring house and Raspberry enclosure temp just because I could -the cost of 5 pack of DS18B20 probes was basically the same as a single probe. I may expand this sensor suite by setting up a smart chicken coop (coming next spring?), possibly using an arduino with wifi shield I have lying around. But for now, were already looking at about 40 data points to log, which is plenty.
The DS18B20 Temperature Probe is a very common and easy to setup sensor. I followed instructions from several sources:
https://learn.adafruit.com/adafruits-raspberry-pi-lesson-11-ds18b20-temperature-sensing/hardware
http://www.reuk.co.uk/wordpress/raspberry-pi/connect-multiple-temperature-sensors-with-raspberry-pi/
Managing API’s
The solar panel data, weather station data, and, obviously, the USGS data are all streamed to other servers first, not to the Pi directly. Therefore, use of API’s was in order. Both our solar installer and AmbientWeather were quick to provide API keys, while the USGS data can be accessed without a key. The process from there was pretty straightforward: just parsing JSON data.
My code’s all at: https://github.com/winedarksea/RaspberryProjects
Connecting to Google
I decided that Google Sheets was my best option for storing data (in addition to storing on the Pi itself). Like I’ve said before, Google already owns me, so why not a bit more? Or a more reasonable answer: because it’s convenient, plays well with everything, and much easier than fancier databases -which aren’t really necessary for a single table. Luckily for me, there’s a package for that. Some instructions need a bit of updating for Google’s newer JSON-stored credentials method.
https://www.raspberrypi.org/forums/viewtopic.php?t=104169
Scheduling:
Easiest, I thought, to just make the computer run the script every fifteen minutes. Cron using Task Scheduler on Raspberry Pi:
sudo python ~/RaspberryProjects/fiveteenMinuteLog.py
For reference: https://www.raspberrypi.org/documentation/linux/usage/cron.md
I also threw in some Raspberry Pi stats into the log, so I can keep an eye on memory usage and heat. You can find a link to that in the Github, or, you know, Google it.
If I am particularly clever, I’ll add a dashboard of this data to this blog, so I can keep an eye on the sensors and connections to see if one goes down.
Here’s looking towards future great analysis projects with this data!